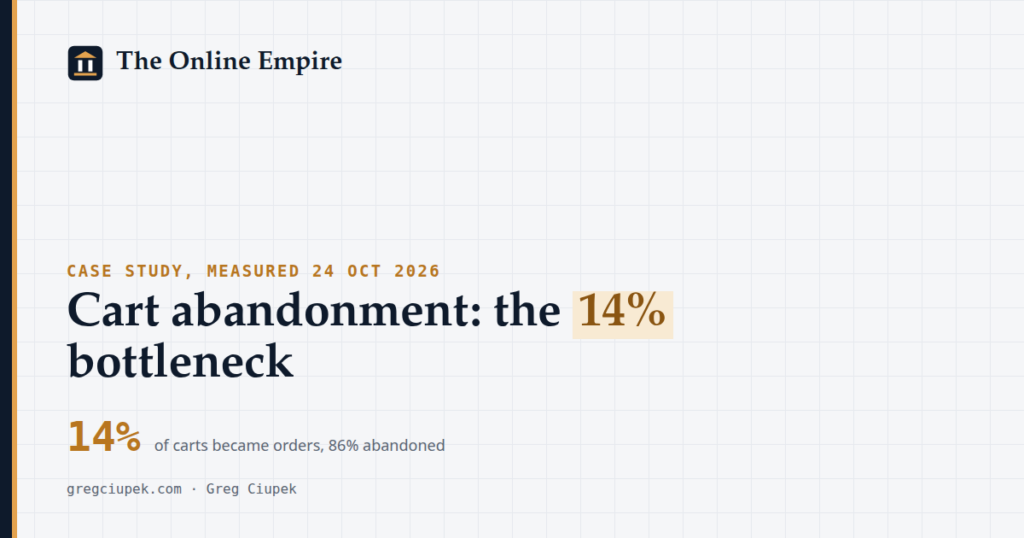
- Cart abandonment is the share of shopping carts that never become orders. In an adult-industry store of mine only 14% of carts became orders on 24 Oct 2026, so 86% were abandoned.
- That cart-to-order step was the bottleneck of the funnel I measured. The store converted 1.76% of human visits after I fixed the payment step (24 Oct 2026).
- For scale, the Baymard Institute averages 50 studies to 70.22% abandonment, with a range of 55–84% (page updated 28 Oct 2026).
- Two of the causes I found were platform settings, not shoppers: a broken payment step and shipping charged as a full parcel for every extra item (about $3.25 each).
- Steps I did not measure separately (checkout started, payment attempted, recovery emails) are marked as not measured below.
Contents · 8 sections
- 01What is cart abandonment, and what was my rate?
- 02Cart abandonment in my store: the full funnel, weak rows included
- 03What does a 14% cart-to-order rate mean in carts and orders?
- 04Why do shoppers abandon carts? Baymard's reasons against what I found
- 05What went wrong in my cart: the platform pitfalls
- 06How to find your own cart abandonment bottleneck, step by step
- 07Frequently asked questions
- 08Sources
This is for store owners who see carts filling up and orders not following, and who want to know what a real cart abandonment problem looks like from the inside. I run several small stores; one of them, an adult-industry store, showed a 14% cart-to-order rate when I looked at its funnel on 24 Oct 2026. Below is how I read that number, what I found behind it and what I still do not know.
No forecasts and no promises. The store gets a dozen or so real people a day, 92% of its traffic is bots, and part of what went wrong was my own platform. That is exactly why the numbers are small, dated and worth looking at.
What is cart abandonment, and what was my rate?
Cart abandonment is the percentage of shopping carts created that do not end in a completed purchase: one minus orders divided by carts, times 100. In an adult-industry store of mine, 14% of carts became orders on 24 Oct 2026, which gives a cart abandonment rate of 86%, about 16 points above Baymard's 70.22% average.
Baymard gives the formula as (1 − completed purchases ÷ carts created) × 100, with the example of 1,000 carts and 300 orders giving 70% (page checked 15 Nov 2026). I use the same definition, so the 86% is directly comparable in form, though not in sample: Baymard's figure is an unweighted average of 50 studies published 2006–2025, mostly from large stores.
Cart abandonment in my store: the full funnel, weak rows included
The cart abandonment numbers sit inside a funnel I only partly measured: a dozen or so real people a day, 92% bot traffic, a 14% cart-to-order rate and 1.76% conversion (24 Oct 2026). Rows I did not measure or do not publish are marked, because a clean-looking funnel with invented steps is worse than an honest gap.
| Step | Number | Status |
|---|---|---|
| Real people a day | a dozen or so | measured, server-log counter |
| Bot share of all traffic | 92% | measured, server-log counter |
| Human visits that added something to the cart | — | not measured separately |
| Carts that reached checkout | — | not measured |
| Checkouts with a payment attempt | — | not measured |
| Carts that became orders | 14% | measured, 24 Oct 2026 |
| Cart abandonment | 86% | arithmetic, 100% − 14% |
| Conversion (orders ÷ human visits) | 1.76% | measured after the payment fix, 24 Oct 2026 |
| Orders, revenue, average order value | — | not published |
It is tempting to divide 1.76% by 14% and call the result the share of visitors who reached a cart. I do not, because I cannot confirm that both figures were counted on the same sessions over the same window. That step stays "not measured" until I count it directly.
An adult-industry store of mine: 14% of carts became orders and conversion was 1.76% after the payment fix (24 Oct 2026); a dozen or so real people a day and 92% of traffic bots (server-log counter). I have no "before the fix" cart-to-order figure I trust enough to print, so I cannot tell you how much the fix moved it.
What does a 14% cart-to-order rate mean in carts and orders?
A 14% cart-to-order rate means 14 orders and 86 abandoned carts for every 100 carts. At Baymard's 70.22% average abandonment, the same 100 carts would give about 30 orders, so the gap between my store and the average is roughly 16 orders per 100 carts. That is arithmetic on two published numbers, not a forecast.
- Orders per 100 carts. 100 × 14% = 14 orders; 86 carts abandoned.
- The benchmark on the same base. 100 × (100% − 70.22%) = 29.78, about 30 orders per 100 carts.
- The gap. 29.78 − 14 = 15.78, about 16 orders per 100 carts. With a dozen or so real people a day, my store does not create 100 carts quickly, which is why one order more or less moves the rate a lot.
- What the gap is worth. I do not publish the store's average order value, so I will not put a dollar figure on it. Put your own order value and margin into the break-even calculator for an online store to see what each recovered cart pays for.
Your abandonment rate depends on what your platform calls a cart. Some count every add-to-cart click, others only carts with an email address. If bots add products to carts, they inflate abandonment the same way they deflate conversion; in my store 92% of traffic was bots, which is why I count people from server logs.
Why do shoppers abandon carts? Baymard's reasons against what I found
According to Baymard's survey of US online shoppers (page checked 15 Nov 2026), 42% have abandoned a cart because they were just browsing. Among the other reasons, extra costs such as shipping, tax and fees lead at 40%. In my store, both problems I could prove sat in that cost-and-payment area.
I put Baymard's list next to what I checked in my own store. "Not measured" means exactly that: I have no data either way, not that the cause was absent.
| Reason (Baymard) | Share | What I found in my store |
|---|---|---|
| Extra costs too high (shipping, tax, fees) | 40% | Found: every extra item charged as a full parcel, about $3.25 each |
| Delivery was too slow | 20% | Not measured |
| Did not trust the site with card details | 19% | Not measured |
| Site wanted me to create an account | 18% | Not measured |
| Too long or complicated checkout | 17% | Not measured |
| Website had errors or crashed | 17% | Found: a broken payment step, fixed before the 1.76% was measured |
| Could not see the total cost up front | 12% | Linked to the shipping bug: the total jumped with a second item |
| Credit card was declined | 10% | Not measured |
| Not enough payment methods | 9% | Not measured |
Baymard's shoppers could pick more than one reason, so the shares do not add up to 100%. The table does not prove that either bug caused my 86%. It shows that the two things I could document both sit in the two categories that shoppers name most often after browsing.
What went wrong in my cart: the platform pitfalls
What went wrong in my cart was mostly platform settings, not product or price: the payment step was broken until I fixed it, and shipping charged a full parcel, about $3.25, for each extra item. Both hit the last screens, where the cart-to-order rate was 14% on 24 Oct 2026.
My stores run on GAPLI, a dropshipping platform for online stores.
That is my own company, so read this knowing I have an interest in it, and knowing that these were our bugs, found in our own stores.
The payment step
The 1.76% conversion rate is the figure after the payment step was fixed. A payment step that fails is the most expensive bug a store can have, because it loses shoppers who have already decided to buy; Baymard's "website had errors or crashed" reason (17%) covers it. I have no reliable "before" rate, which is the honest weak spot of this case study.
Shipping for every extra item
A second product in the cart was charged as a full extra parcel, about $3.25 more, and a third one another $3.25. A shopper building a bigger order saw the shipping line climb on the final screens. That is the worst place for a surprise: Baymard's top avoidable reason is extra costs (40%), and "could not see the total cost up front" adds another 12%.
When is GAPLI not the right choice? If you sell in the US or UK and want the widest choice of checkout apps and payment providers out of the box, compare the hosted and self-hosted routes first in Shopify vs WooCommerce. The checks below work on any platform.
How to find your own cart abandonment bottleneck, step by step
To find your cart abandonment bottleneck, count carts and paid orders from the store database, compute the rate with Baymard's formula, then walk the last screens yourself with two or more items and every payment method. That is how I found both bugs behind my 14% cart-to-order rate in October 2026.
- Define a cart. Decide whether a cart is any add-to-cart or only a cart with an email address, write it down and keep it fixed.
- Count humans, not hits. Exclude bots before you compute anything. My store's traffic was 92% bots; on the Empire Counter you can see how we count people on our sites.
- Compute the rate. Abandonment = (1 − paid orders ÷ carts) × 100. Use paid orders from the database, not analytics purchase events.
- Split the steps you can. Cart to checkout, checkout to payment attempt, payment attempt to paid order. I did not have these splits, and that is the first thing I would add.
- Buy from yourself. One item, then three items, with each payment method and each delivery option. Watch the shipping line, the tax line and the total on every screen.
- Fix one thing, then wait. With a dozen or so people a day, a single order moves the rate. Let a change collect enough orders before you judge it, and compare the same length of time before and after.
For the conversion side of the same store, with the bot arithmetic worked through, read ecommerce conversion rate: 1.76% after fixing payments. The rest of my store numbers are under ecommerce.
Frequently asked questions
How do you calculate cart abandonment rate?
Cart abandonment rate is (1 − completed purchases ÷ carts created) × 100, the formula Baymard publishes (checked 15 Nov 2026). In my adult-industry store 14% of carts became orders on 24 Oct 2026, so abandonment was 86%. Count paid orders from the store database and exclude bots first.
What is a normal cart abandonment rate?
Baymard averages 50 studies published 2006–2025 to 70.22%, with a range of 55% to 84% (updated 28 Oct 2026). Definitions differ between studies, so the best comparison is your own store before and after a change. My store's 86% was well above that average.
What is the most common reason for cart abandonment?
In Baymard's survey of US shoppers, 42% abandoned because they were just browsing. Among the other reasons, extra costs such as shipping, tax and fees lead at 40% (checked 15 Nov 2026). In my store, shipping charged at about $3.25 per extra item was exactly that kind of cost.
Is 86% cart abandonment bad?
It is about 16 points above Baymard's 70.22% average, so it was the weakest step in my funnel on 24 Oct 2026. In practice it meant 14 orders per 100 carts instead of the roughly 30 the average implies. With a dozen or so real visitors a day, the number moves a lot with each single order.
What should I check first to reduce cart abandonment?
Check the last screens: whether every payment method works, and whether shipping and tax change unexpectedly when a second item is added. Both of the problems I documented in my store sat there. Then split the funnel so you know which screen loses people.
Sources
- Baymard Institute, Cart Abandonment Rate: 50 Statistics & Why People Abandon (2026): 70.22% average, 55–84% range, formula and abandonment reasons (updated 28 Oct 2026, checked 15 Nov 2026): baymard.com
- The Online Empire, fleet fact register: cart-to-order rate, conversion after the payment fix and bot share of an adult-industry store (24 Oct 2026); platform pitfalls, including shipping per extra item (Oct 2026).
As of 15 Nov 2026. Store figures (14% cart-to-order, 1.76% conversion) are from 24 Oct 2026; traffic and bot share from the server-log counter. The extra-item shipping cost was converted to dollars at the October 2026 rate. I checked the Baymard page on 15 Nov 2026; its list was last updated on 28 Oct 2026.