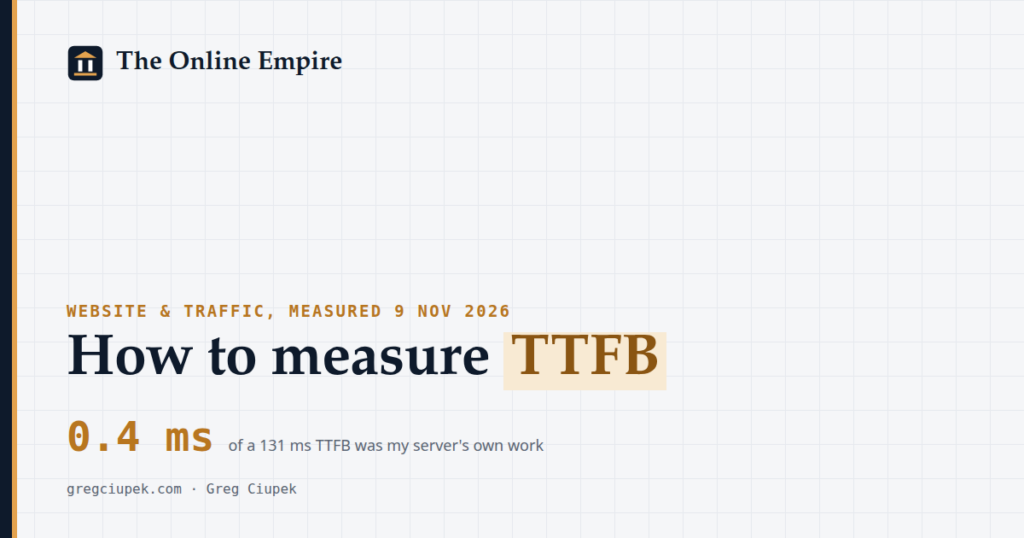
- How to measure TTFB: time
%{time_starttransfer}with curl ten times on new connections and take the median. Cost $0; my 130 requests took 38 seconds. - Five of my sites, 9 Nov 2026, from Poland: 130–131 ms from cache, 277–344 ms when WordPress built the page.
- Same cached page on an open connection: 32 ms. On the server itself the cache took 0.4 ms, WordPress 160–167 ms.
- Three of my four busiest landing pages missed the cache on the first request: 290–573 ms, then about 130 ms.
- Google's web.dev: 0.8 s or less is good, over 1.8 s poor (updated 18 Nov 2025).
Contents · 8 sections
- 01How to measure TTFB: what exactly are you timing?
- 02How to measure TTFB across real sites: our test on 9 Nov 2026
- 03How to measure TTFB step by step (free, about 10 minutes)
- 04How to measure TTFB without network noise: cold, warm and server-side
- 05How to measure TTFB on the pages that matter
- 06How to measure TTFB in the browser and in Google's tools
- 07Frequently asked questions
- 08Sources
This guide is for you if a speed test flagged your server response time and you want to check it yourself before paying for new hosting. You need a terminal and ten minutes.
On 9 Nov 2026, between 14:38 and 14:41 Central European Time, I timed five sites of my fleet and two comparison hosts with curl, 10 runs each, then repeated the test on a reused connection and on the server itself. Comparing those three numbers is what most guides skip.
How to measure TTFB: what exactly are you timing?
To measure TTFB you time the gap between starting a request and receiving the first byte of the answer. Google's web.dev (updated 18 Nov 2025) defines it as redirects, service worker startup, DNS lookup, connection and TLS setup, plus the request until the first byte arrives. On my sites on 9 Nov 2026, setup alone took about 69 ms.
Tools report different slices of it. curl's time_starttransfer runs "from the start until the first byte was received" (curl manual), so it matches web.dev's TTFB for a URL without redirects. Chrome DevTools' "Waiting (TTFB)" bar covers only one round trip plus the server's work, per Chrome's documentation, so it shows less than curl for the same page.
TTFB is distance plus setup plus server work; a good measurement separates the three.
How to measure TTFB across real sites: our test on 9 Nov 2026
Measured from my computer in Poland on 9 Nov 2026, five of my WordPress sites served cached pages with a median TTFB of 130–131 ms and uncached pages in 277–344 ms. A page served by a global CDN (example.com) answered in 58 ms, and wordpress.org, much farther away, in 373 ms. I repeated the test a week later with a server-side round and test servers on three continents in my hosting speed test.
Every run opened a new connection, like a first-time visitor. To make WordPress build the page, I added a random query string (?n12345); the x-litespeed-cache header confirmed "hit" or "miss" on every run. DNS took about 1 ms everywhere.
| Page | TCP done | TLS done | TTFB median | Fastest–slowest |
|---|---|---|---|---|
| gregciupek.com, cached | 32 ms | 70 ms | 131 ms | 100–133 ms |
| gregciupek.com, uncached | 31 ms | 70 ms | 277 ms | 272–299 ms |
| tillradar.co.uk, cached | 31 ms | 69 ms | 130 ms | 99–132 ms |
| tillradar.co.uk, uncached | 32 ms | 69 ms | 342 ms | 293–415 ms |
| mainstreetradar.com, cached | 32 ms | 69 ms | 130 ms | 100–130 ms |
| mainstreetradar.com, uncached | 31 ms | 69 ms | 300 ms | 295–328 ms |
| madrydochod.pl, cached | 32 ms | 69 ms | 130 ms | 100–131 ms |
| madrydochod.pl, uncached | 31 ms | 69 ms | 344 ms | 334–424 ms |
| kontowtescie.pl, cached | 31 ms | 69 ms | 130 ms | 99–130 ms |
| example.com (CDN, comparison) | 16 ms | 38 ms | 58 ms | 57–73 ms |
| wordpress.org (comparison) | 123 ms | 251 ms | 373 ms | 372–390 ms |
The cached TTFB is identical on all five sites because they share one server: what you see is the network. Uncached pages vary (277–344 ms) because each WordPress install does different work. The server belongs to my company, Aderlo Cloud, and sits at Hetzner in Germany (RIPE registry, checked 9 Nov 2026). For US readers that adds distance, so Aderlo Cloud is not the right pick if most of your visitors are in America; I compared hosts by measurement in best web hosting for small business.
How to measure TTFB step by step (free, about 10 minutes)
To measure TTFB yourself you need curl, five to ten URLs and about ten minutes, at no cost. Run each URL ten times on a fresh connection, note the median, then repeat with a cache-busting query string and on a reused connection. My 130 requests on 9 Nov 2026 took 38 seconds in total.
- Pick the pages people land on, not only the home page. Take them from analytics or server logs.
- Time the first request on its own. Run
curl -o /dev/null -s -w '%{time_starttransfer} %header{x-litespeed-cache}\n' https://your-site/page/once. Print your own cache header if it differs (cf-cache-statuson Cloudflare);%header{}needs curl 7.84 or newer. - Run it ten times and take the median.
for i in $(seq 10); do curl -o /dev/null -s -w '%{time_starttransfer}\n' https://your-site/; donegives ten cold runs; the median ignores one slow outlier. - Split it into phases. Add
%{time_namelookup} %{time_connect} %{time_appconnect}. Time aftertime_appconnectis request plus server work; before it, DNS, distance and TLS. - Measure an uncached page. Add a random query string (
?n123) and check the header says "miss". - Measure a warm connection. Give one curl command the same URL ten times (
-o /dev/null URL -o /dev/null URL …); curl reuses the connection, so requests 2 to 10 show a visitor's second click. - Measure on the server, if you can.
curl --resolve your-site:443:SERVER_IP …run there removes the network. - Note the date, time and place. My numbers are from Poland; a reader in Texas sees more.
One run can mislead. My first check of the gregciupek.com home page on 9 Nov 2026 was a cache miss, the next a hit: roughly 280 ms or 131 ms for the same page, depending on luck.
How to measure TTFB without network noise: cold, warm and server-side
To see what your server does, compare three numbers for the same page: a new connection, a reused connection and a request made on the server. For my cached home page on 9 Nov 2026 they were 131 ms, 32 ms and 10 ms, and only 0.4 ms of that was the cache answering.
| Page | Cold, from Poland | Warm, from Poland | On the server | Server work only |
|---|---|---|---|---|
| gregciupek.com, cached | 131 ms | 32 ms | 10.2 ms | 0.4 ms |
| gregciupek.com, uncached | 277 ms | 191 ms | 170.2 ms | 160.4 ms |
| tillradar.co.uk, cached | 130 ms | 32 ms | 10.3 ms | 0.5 ms |
| tillradar.co.uk, uncached | 342 ms | 180 ms | 176.5 ms | 167.1 ms |
"Server work only" is the server-side TTFB minus the TLS handshake (about 10 ms even locally). On a cached page, nearly all of the 131 ms is the road between Poland and Germany: about 31 ms per round trip, repeated for TCP, TLS and the request. On an uncached page, about 160 ms is WordPress building HTML; only a cache removes it.
Server work was 0.4 ms of a 131 ms cached TTFB and about 160 ms of a 277 ms uncached one (9 Nov 2026). In the first case a "faster" server barely helps; a CDN or a closer server does.
How to measure TTFB on the pages that matter
To measure TTFB where it counts, start with the pages people actually land on and time the first request separately. On 9 Nov 2026, three of my four busiest landing pages from the previous day were not in cache: the first request took 290–573 ms, and every request after it about 130 ms.
I took the landing pages from my server-log counters for 8 Nov 2026 and measured each ten times at 14:41 CET the next day. With a handful of visitors a day the cache rarely stays warm, so the "first visitor" is a large share of all visitors.
| Site and page | People on 8 Nov | ChatGPT user fetches on 8 Nov | First request | Median of 10 |
|---|---|---|---|---|
| gregciupek.com, /make-money-online-scams/ | 4 (2 landed here) | 0 | 304 ms (miss) | 131 ms |
| mainstreetradar.com, /is-irs-down/ | 3 (2 landed here) | 31 (21 on this page) | 573 ms (miss) | 130 ms |
| tillradar.co.uk, a business-account page | 3 (1 landed here) | 30 | 290 ms (miss) | 130 ms |
| madrydochod.pl, business account for a simple joint-stock company | 15 (3 landed here) | 57 | 130 ms (hit) | 130 ms |
"ChatGPT user fetches" are requests from ChatGPT's user agent, made when someone asks ChatGPT about a page. On mainstreetradar.com they outnumbered human visitors 31 to 3 that day, and they hit cold pages too (more in how to get cited by ChatGPT). The fix is a cache warm-up, crawling your own sitemap after each purge, checked with the measurement above.
How to measure TTFB in the browser and in Google's tools
In the browser, you can read TTFB from Chrome DevTools or from one line of JavaScript; in Google's tools, PageSpeed Insights shows field TTFB from the Chrome UX Report when a site has enough visitors. Google's web.dev (updated 18 Nov 2025) treats 0.8 seconds or less as good and over 1.8 seconds as poor.
Chrome DevTools
In DevTools: Network tab, reload, click the document, open Timing. "Waiting (TTFB)" is only the request and server part (Chrome documentation, updated 16 Jul 2024); to compare with curl, add the bars from "DNS Lookup" to "Waiting".
One line in the console
Type performance.getEntriesByType('navigation')[0].responseStart in the console. It returns milliseconds from navigation start to the first byte, the browser's version of web.dev's TTFB (MDN, page modified 28 Oct 2025).
PageSpeed Insights and the Chrome UX Report
Field data shows real Chrome users at the 75th percentile, but only for pages and origins that are "sufficiently popular"; Chrome does not disclose the minimum. With 3 to 15 people a day on 8 Nov 2026 (live numbers on the counter), curl is my main tool. Chrome's documentation (updated 13 Oct 2026) also warns that field TTFB mixes cold loads, cached loads and established connections, the split my test shows.
Frequently asked questions
What is a good TTFB?
Google's web.dev (updated 18 Nov 2025) calls 0.8 seconds or less good and over 1.8 seconds poor, at the 75th percentile of real users. My pages measured 130 ms cached and 277–344 ms uncached from Poland on 9 Nov 2026.
Is TTFB a Core Web Vital?
No. web.dev says TTFB is not a Core Web Vitals metric, so it need not meet the "good" threshold if it does not hold back First Contentful Paint and Largest Contentful Paint.
Why does my TTFB change every time I test?
Usually cache and connection state. On 9 Nov 2026 one page measured 131 ms on a new connection, 32 ms on an open one and 277 ms uncached. Run ten tests, use the median, check the cache header.
How much does it cost to measure TTFB?
Nothing. curl, Chrome DevTools and PageSpeed Insights are free. My 130 requests took 38 seconds; choosing pages took longer.
Should I change hosting because of TTFB?
Only after splitting the number. If most of it is network, a CDN or a closer server helps; if server work is large, caching helps first. More guides under website and traffic.
Sources
- Own measurement, curl from Poland and on the hosting server, 10 runs per URL (9 Nov 2026, 14:38–14:41 CET), five fleet sites plus example.com and wordpress.org; server-log counters for 8 Nov 2026 (read 9 Nov 2026)
- web.dev (Google), Time to First Byte (TTFB) (published 26 Oct 2021, updated 18 Nov 2025, checked 9 Nov 2026): web.dev
- curl, curl man page: write-out variables (checked 9 Nov 2026): curl.se
- Chrome for Developers, Network features reference: timing breakdown (updated 16 Jul 2024, checked 9 Nov 2026): developer.chrome.com
- Chrome for Developers, Chrome UX Report: Metrics (updated 13 Oct 2026, checked 9 Nov 2026): developer.chrome.com
- Chrome for Developers, Chrome UX Report: Methodology, eligibility (updated 20 Jun 2024, checked 9 Nov 2026): developer.chrome.com
- MDN Web Docs, PerformanceResourceTiming: responseStart property (modified 28 Oct 2025, checked 9 Nov 2026): developer.mozilla.org
- RIPE NCC, RDAP record for the hosting server's IP address (checked 9 Nov 2026): rdap.db.ripe.net
As of 9 Nov 2026. TTFB measured that day from my computer in Poland (curl 8.5.0, 10 runs per URL, new connection each, median) at 14:38–14:41 CET and on the hosting server (curl 7.76.1) at 14:40 CET; uncached pages forced with a random query string and confirmed by the x-litespeed-cache header. Visitor and ChatGPT fetch counts from my server-log counters for 8 Nov 2026. US and UK readers will see other absolute numbers because of distance. The PageSpeed Insights API was over quota that day, so no Google lab score is quoted.